> For the complete documentation index, see [llms.txt](https://docs.seasketch.org/seasketch-documentation/llms.txt). Markdown versions of documentation pages are available by appending `.md` to page URLs; this page is available as [Markdown](https://docs.seasketch.org/seasketch-documentation/administrators-guide/overlay-layers/the-data-library.md).
# The Data Library
The SeaSketch team is developing a growing set of curated data layers from authoritative sources. The goal of the data library is to provide commonly-used datasets with excellent cartography and interactivity settings ready to use "out of the box" and to support custom integrations with bespoke web services and catalogs that would be impossible to automate otherwise.
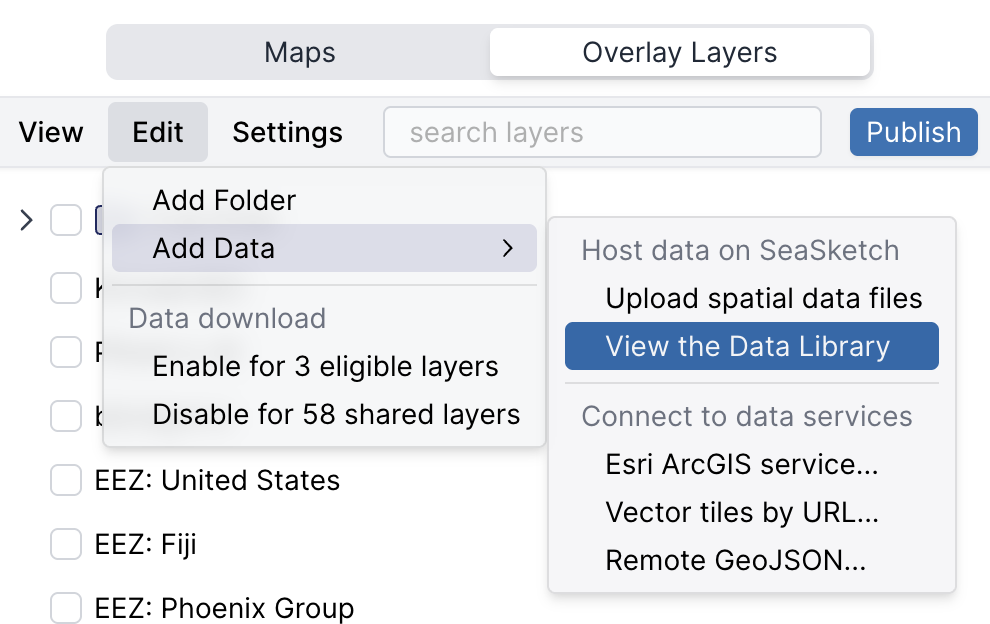
To access the Data Library, choose **Edit > Add Data > View the Data Library** from the Overlays administration page.
The Data Library currently includes data from NOAA Coral Reef Watch and iNaturalist. Our intention is to grow this resource over time. Please contact if you would like your data to be included, or there is a data source that you would like added that is otherwise difficult to integrate with SeaSketch.
#### NOAA Coral Reef Watch
The[ National Oceanic and Atmospheric Administration's Coral Reef Watch](https://coralreefwatch.noaa.gov/) provides NetCDF products derived from remote sensing data to monitor coral reef bleaching. SeaSketch pulls data from NOAA's servers daily and updates a set of 6 data layers automatically. Should you choose to add these datasets to your project, they will also be updated as new data becomes available (typically every 24 hours). With the layers added to your project, you may still customize cartography and interactivity settings while receiving source updates.
#### iNaturalist
Using this integration, administrators can create layers representing observations in [iNaturalist](https://www.inaturalist.org/). The tool can be used to create layers showing all observations from a given iNaturalist project in order to highlight *citizen science* efforts, or for particular taxonomic groups to show where observations have been made of particular species. Administrators can enable an optional *call to action banner* to encourage viewers of the layer to contribute their own observations to an iNaturalist project.